
Study · 2026 tax rules
Take-home pay by state: the same $75,000 salary, 51 different paychecks
We ran a $75,000 salary through our 2026 paycheck calculator for every state and Washington, DC. The gap between the best and worst state is $6,257 a year, about $521 a month.
$50,000 $75,000 $100,000 $150,000
9 states tie or nearly tie at the top because they have no state income tax on wages: Florida, Nevada, New Hampshire, South Dakota, Tennessee, Texas, Wyoming, Alaska, Washington. Some of them still take a small payroll deduction, such as Washington’s paid leave and long-term care programs.
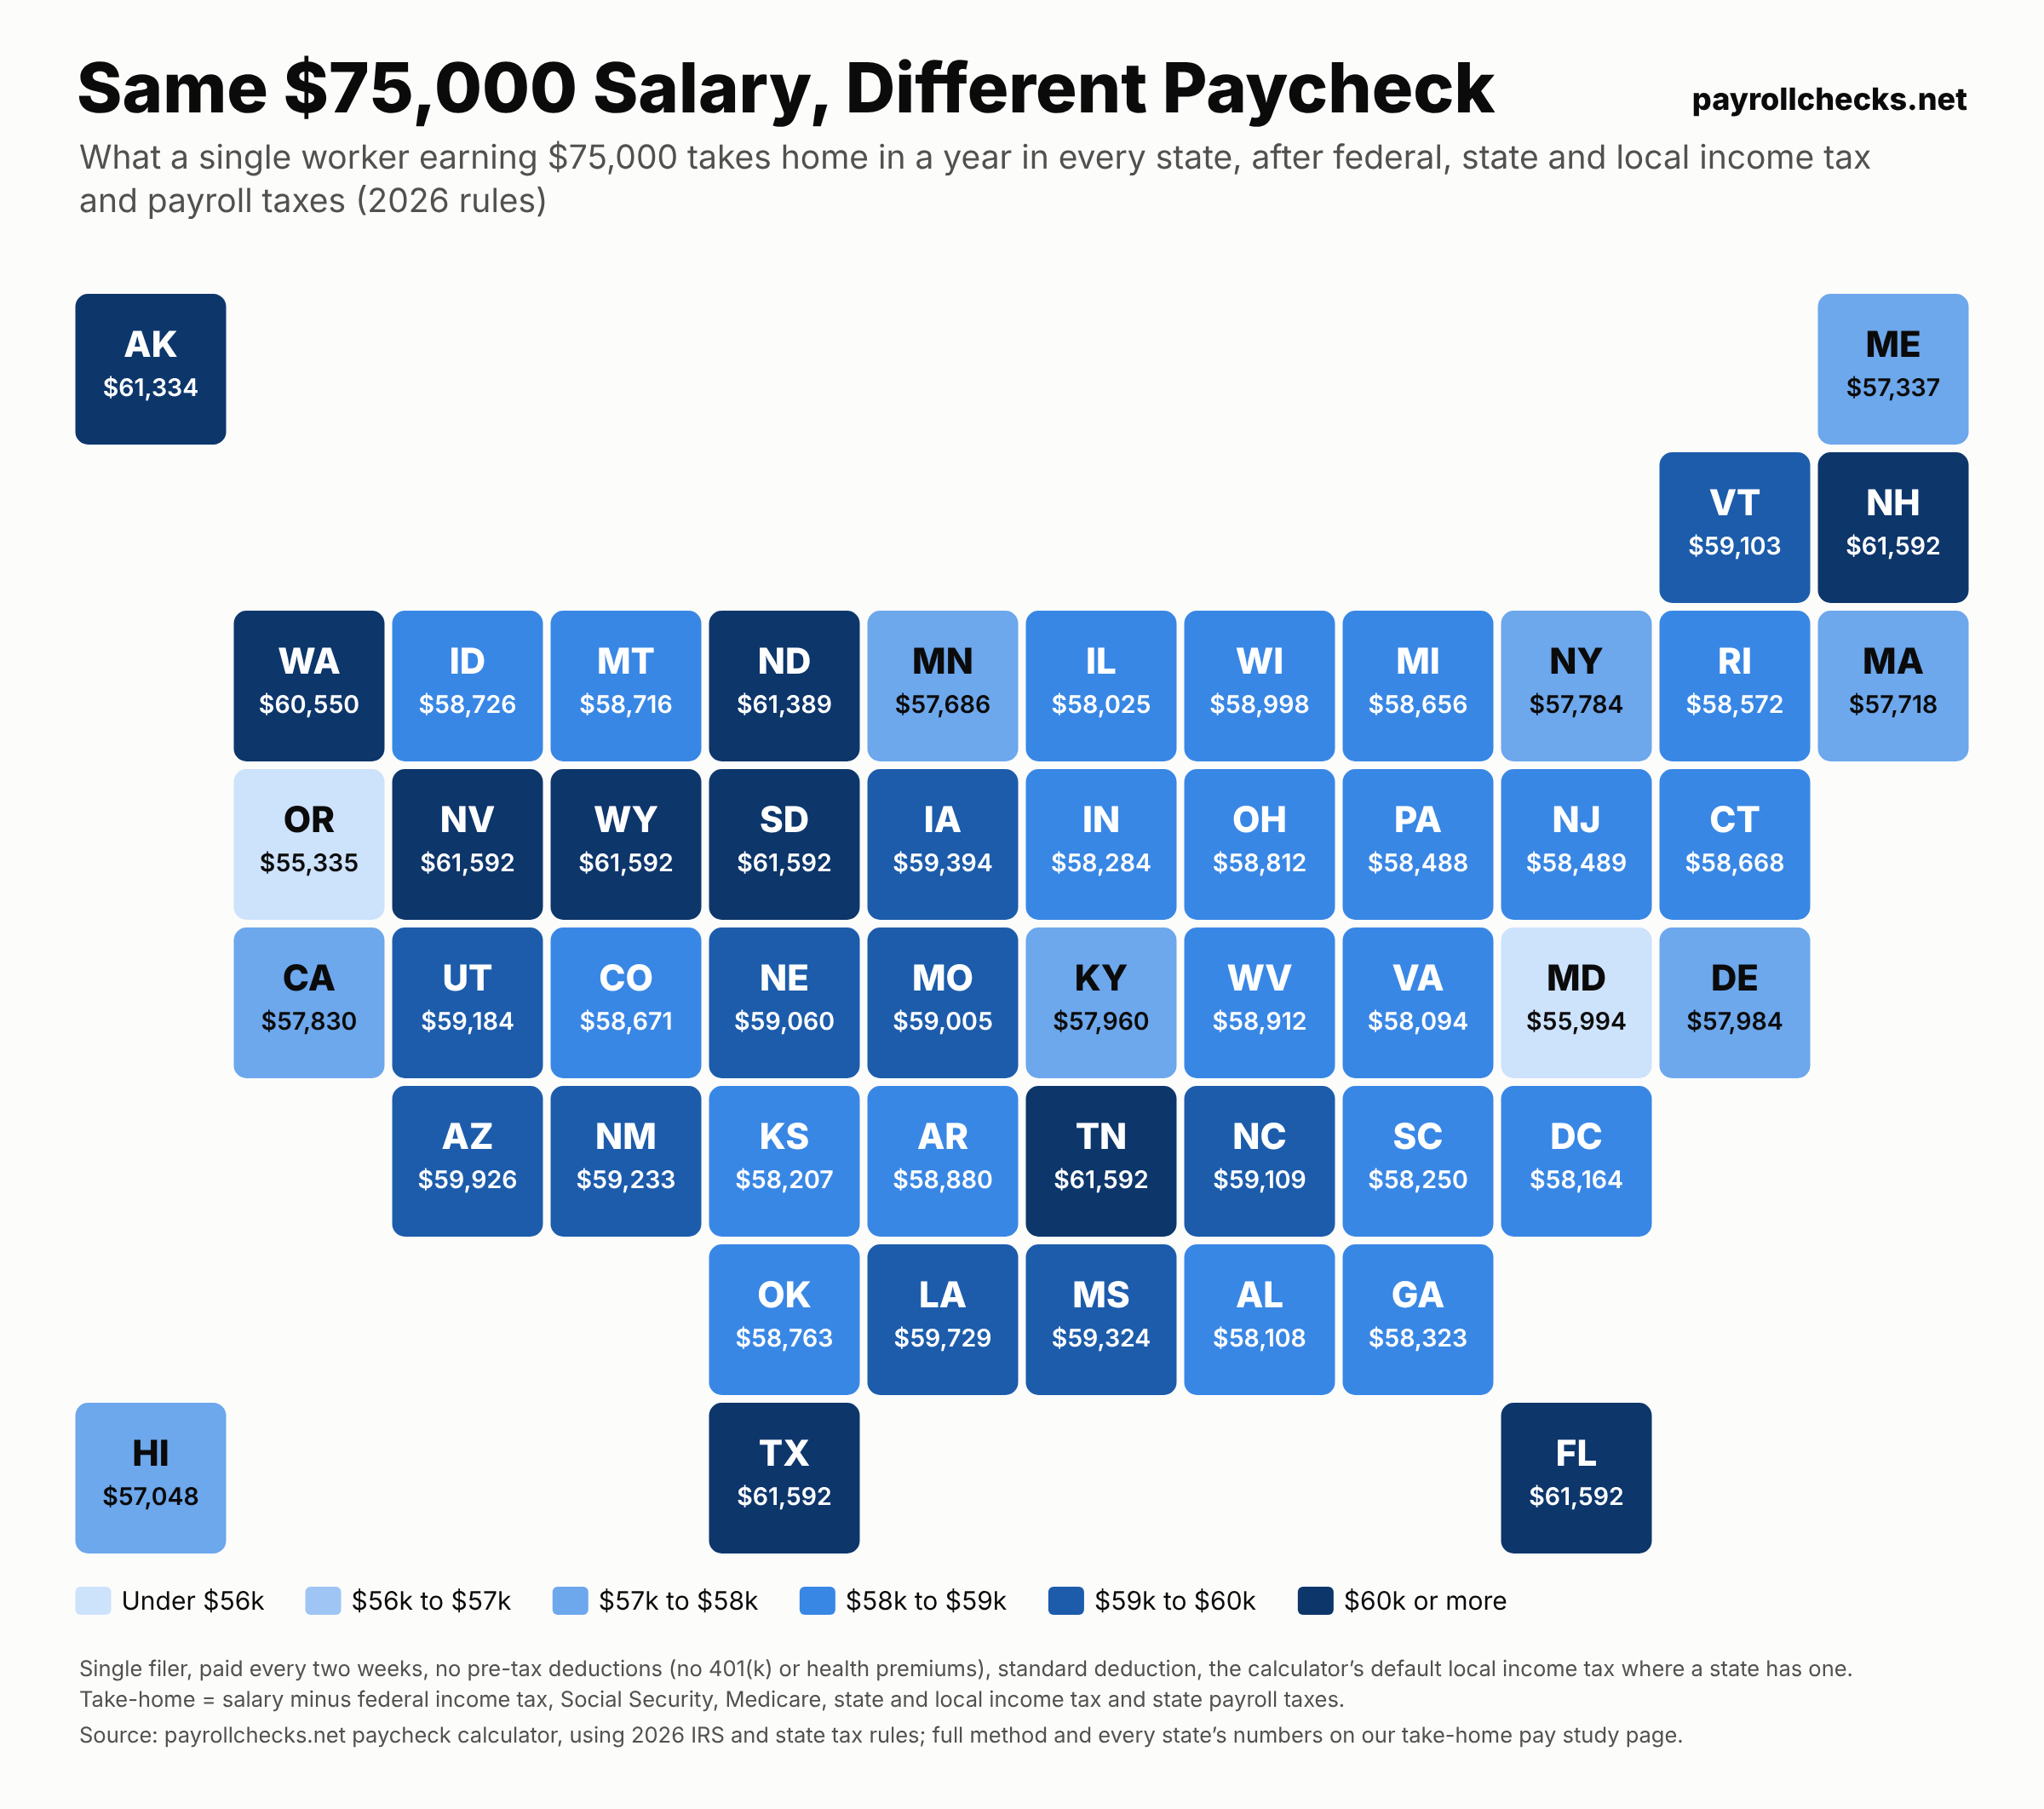
| Rank | State | Take-home pay | State income tax | Other state and local | Less than #1 |
|---|---|---|---|---|---|
| 1 | Florida | $61,592 | $0 | $0 | |
| 1 | Nevada | $61,592 | $0 | $0 | |
| 1 | New Hampshire | $61,592 | $0 | $0 | |
| 1 | South Dakota | $61,592 | $0 | $0 | |
| 1 | Tennessee | $61,592 | $0 | $0 | |
| 1 | Texas | $61,592 | $0 | $0 | |
| 1 | Wyoming | $61,592 | $0 | $0 | |
| 8 | North Dakota | $61,389 | $203 | $0 | -$203 |
| 9 | Alaska | $61,334 | $0 | $258 | -$258 |
| 10 | Washington | $60,550 | $0 | $1,042 | -$1,042 |
| 11 | Arizona | $59,926 | $1,666 | $0 | -$1,666 |
| 12 | Louisiana | $59,729 | $1,864 | $0 | -$1,863 |
| 13 | Iowa | $59,394 | $2,198 | $0 | -$2,198 |
| 14 | Mississippi | $59,324 | $2,268 | $0 | -$2,268 |
| 15 | New Mexico | $59,233 | $2,359 | $0 | -$2,359 |
| 16 | Utah | $59,184 | $2,409 | $0 | -$2,408 |
| 17 | North Carolina | $59,109 | $2,484 | $0 | -$2,483 |
| 18 | Vermont | $59,103 | $2,490 | $0 | -$2,489 |
| 19 | Nebraska | $59,060 | $2,533 | $0 | -$2,532 |
| 20 | Missouri | $59,005 | $2,588 | $0 | -$2,587 |
| 21 | Wisconsin | $58,998 | $2,594 | $0 | -$2,594 |
| 22 | West Virginia | $58,912 | $2,680 | $0 | -$2,680 |
| 23 | Arkansas | $58,880 | $2,712 | $0 | -$2,712 |
| 24 | Ohio incl. 2% local | $58,812 | $1,280 | $1,500 | -$2,780 |
| 25 | Oklahoma | $58,763 | $2,830 | $0 | -$2,829 |
| 26 | Idaho | $58,726 | $2,867 | $0 | -$2,866 |
| 27 | Montana | $58,716 | $2,877 | $0 | -$2,876 |
| 28 | Colorado | $58,671 | $2,592 | $330 | -$2,921 |
| 29 | Connecticut | $58,668 | $2,550 | $375 | -$2,924 |
| 30 | Michigan | $58,656 | $2,937 | $0 | -$2,936 |
| 31 | Rhode Island | $58,572 | $2,196 | $825 | -$3,020 |
| 32 | New Jersey | $58,489 | $2,598 | $505 | -$3,103 |
| 33 | Pennsylvania incl. 1% local | $58,488 | $2,302 | $803 | -$3,104 |
| 34 | Georgia | $58,323 | $3,270 | $0 | -$3,269 |
| 35 | Indiana incl. 1.5% local | $58,284 | $2,183 | $1,125 | -$3,308 |
| 36 | South Carolina | $58,250 | $3,343 | $0 | -$3,342 |
| 37 | Kansas | $58,207 | $3,385 | $0 | -$3,385 |
| 38 | District of Columbia | $58,164 | $3,428 | $0 | -$3,428 |
| 39 | Alabama | $58,108 | $3,485 | $0 | -$3,484 |
| 40 | Virginia | $58,094 | $3,498 | $0 | -$3,498 |
| 41 | Illinois | $58,025 | $3,568 | $0 | -$3,567 |
| 42 | Delaware | $57,984 | $3,609 | $0 | -$3,608 |
| 43 | Kentucky incl. 1.5% local | $57,960 | $2,507 | $1,125 | -$3,632 |
| 44 | California | $57,830 | $2,788 | $975 | -$3,762 |
| 45 | New York | $57,784 | $3,453 | $355 | -$3,808 |
| 46 | Massachusetts | $57,718 | $3,530 | $345 | -$3,874 |
| 47 | Minnesota | $57,686 | $3,577 | $330 | -$3,906 |
| 48 | Maine | $57,337 | $3,881 | $375 | -$4,255 |
| 49 | Hawaii | $57,048 | $4,170 | $375 | -$4,544 |
| 50 | Maryland incl. 3.2% local | $55,994 | $3,199 | $2,400 | -$5,598 |
| 51 | Oregon | $55,335 | $5,733 | $525 | -$6,257 |
How we calculated it
Every figure comes from the same 2026 tax math as our paycheck calculator: a single filer, paid every two weeks, with no 401(k), health premiums or other pre-tax deductions. We subtract federal income tax, Social Security, Medicare, state income tax and any state payroll deductions such as paid family leave. Where a state has a local income tax almost everyone pays, we include the same typical rate the calculator prefills (marked "incl. local" above); your county or city may differ.
Your own number will differ if you are married, have children, contribute to a 401(k) or live in a city with its own wage tax. Compare two states for your exact situation.
Use this data
Journalists and bloggers are welcome to cite these figures with a link to this page. Download every state at every salary (CSV). Want it on your site? Embed the two-state comparison tool.
Frequently asked questions
Which state has the highest take-home pay on $75,000?
Florida, Nevada, New Hampshire, South Dakota, Tennessee, Texas, Wyoming tie at about $61,592 a year, because none of them tax wages or take a state payroll deduction at this salary.
Which state has the lowest take-home pay on $75,000?
Oregon, at about $55,335 a year, $6,257 less than the top state.
Does this include local taxes?
Only where a local income tax is near-universal (Ohio, Pennsylvania, Indiana, Kentucky, Maryland), using a typical rate. City taxes like New York City’s are not included.